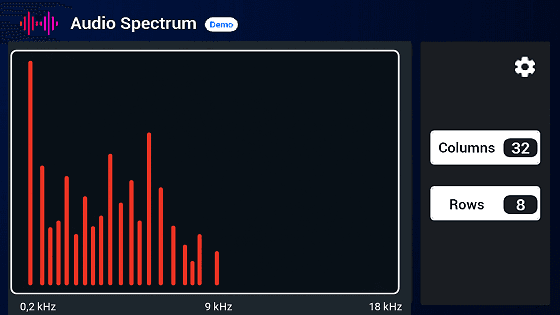
Proculus Technologies Co., Ltd.
TY_EMAIL_US

Audio Analyzer Application

The Audio Analyzer project is a technical demonstration that displays the frequency spectrum of an audio signal in real time. The audio is transmitted from an external device (such as a smartphone or computer) to the system via a P2 cable, and a microcontroller processes the signal so the display can show the amplitude distribution across the frequency spectrum. The graph shown on the display represents the signal intensity across different frequency ranges, covering approximately 0.2kHz to 18kHz. The graphical interface allows users to adjust settings such as grid resolution, spectrum colors, and interface language.

Key Features


Audio spectrum visualization: Displays signal amplitude as a function of frequency.
Resolution adjustment: Configurable number of columns and rows (8, 16, or 32).
Visual customization: Spectrum colors (red, green, or blue) and background colors (black, gray, or white).
Language selection: Interface available in English, Portuguese, and Spanish.
Touchscreen control: All configurations are made directly through the display interface.


Components Used


Hardware:
• Smart+ Display
• Microcontroller
• Stereo P2 cable
• 12V @ 1A power supply


Software:
UnicView Studio: Used to design and transfer the interface to the display.


How to Use the Project

  1. Connect power: Plug the 12V power supply into the back of the system.
  2. Connect audio: Insert the P2 cable into both the system and the audio source device.
  3. Configure the interface: Use the touchscreen to set resolution, colors, and language as needed.

Demo Purpose
This demonstration was created for technical and presentation purposes, showing how the system can visually represent the spectral distribution of audio signals in real time with a configurable graphical interface.

Downloads and Resources
• Project on GitHub